Chart of the Week01 Aug 2025
The Great US Macro Vol Collapse
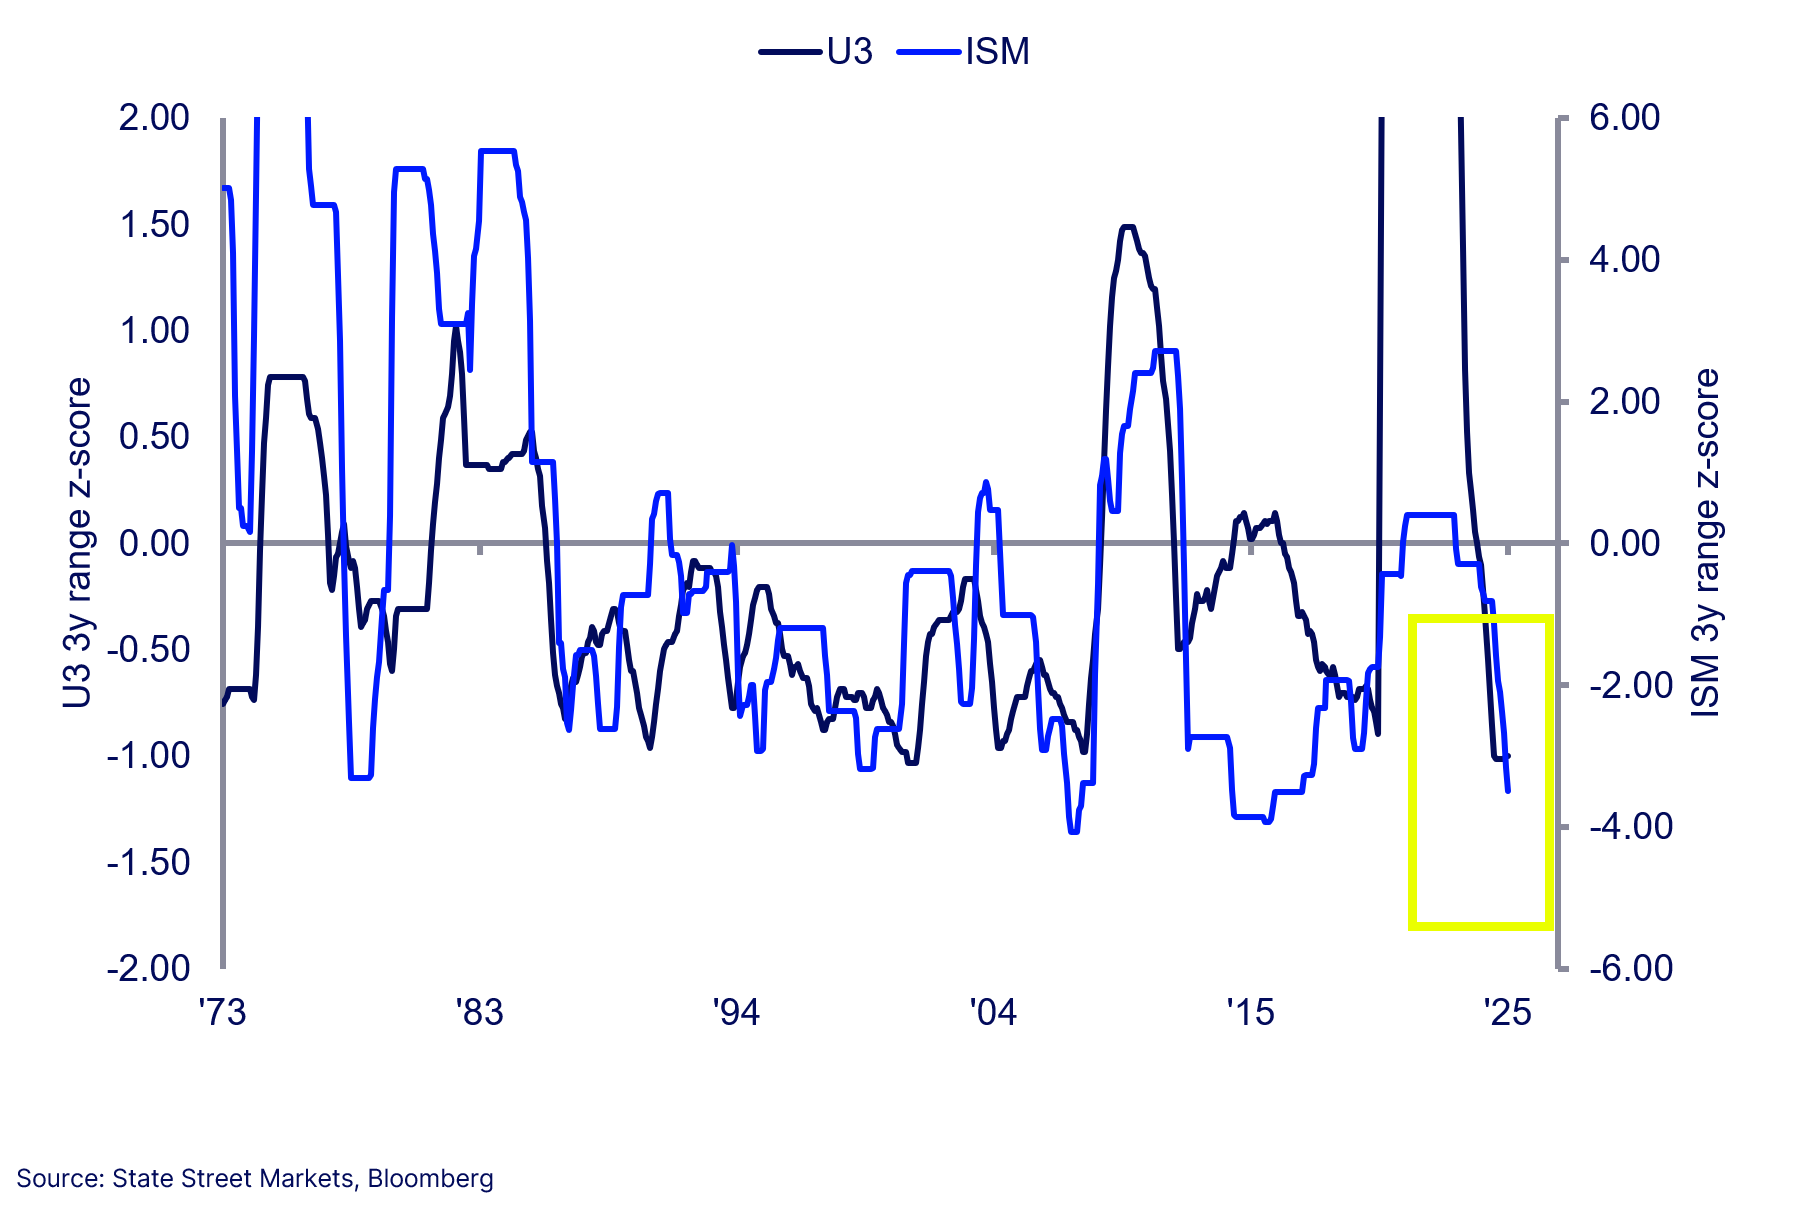
A measure of US macro growth volatility is constructed for U3 unemployment rate and ISM. It is based on 3m rolling averages and the 3y range of those averages. A Z-score for each is constructed. The result shows a remarkable level of stability. Quite worryingly, you must go back to Q4 2007 to find an example of where the average of these two series was so low. Of course, that was just ahead of the NBER recession that began in Dec-2007. Other examples include late 1999, 1979 and 1970. Recessions followed all of these “quiet” periods. Meanwhile Polymarket has a mere 12% probability of recession in 2025, down from 65%.